The Complete Guide to the Best PowerPoint Add-ins


Maurizio La Cava makes presentations every day and makes extensive use of PowerPoint add-ins, so he has put together a list of what he considers to be the best ones, grouped for top functions and discusses them in detail below.
With millions of presentations delivered every day, PowerPoint has become a core tool for anybody who needs to present a project and persuade others to adopt their ideas. If you are a manager, a student or an entrepreneur, there is every chance that you’ve used PowerPoint at least once in the last few days.
PowerPoint is an easy and accessible tool within the Microsoft Office suite. However, PowerPoint users are struggling, and the amount of time wasted on presentations is growing faster than ever.
Creating a presentation takes a long time: you need to structure the story; you need to gather all information; and then the design process starts. You’ll need to visualize concepts on your slides; look for images or icons that are relevant to your message; and then you’ll have to work on the multiple formatting options that PowerPoint offers. This means that, as the bare minimum, you’ll probably have to fix alignments between objects, select a proper font, define a color palette, setup the slide master in PowerPoint, etc.
Those could be easy fixes if you are good with PowerPoint, but what if you are not? Manually creating the layout for slides can take a long time and, moreover, can be quite inaccurate. Imagine spending a lot of time on a presentation, only to produce ineffective slides. Not only will you have wasted your time, but you’ll be wasting the time of people who decided to come to your ineffective presentation, only to fall asleep during your speech.
There are some magic tools that can really improve the quality and the effort input in your presentations. We call these tools PowerPoint add-ins.
What is an add-in?
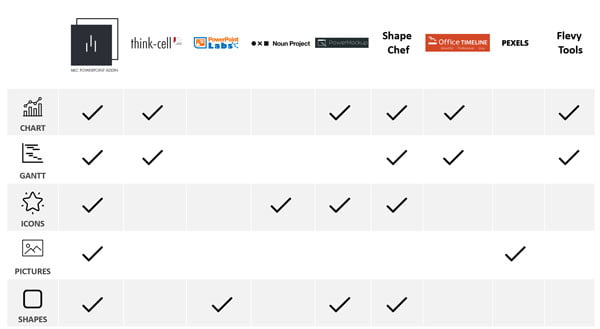
PowerPoint add-ins are simple and powerful tools that automate crucial parts of your job when working in PowerPoint. If you look on the web, you’ll find an infinite list of PowerPoint add-ins but, honestly, there are many that are not very useful. These are the ones that I think are worth a further look:
I believe these are the add-ins that can really improve the way you work and make you much faster and more accurate. In this article we will take a look at each of them in more detail.
MLC PowerPoint Addin
The MLC PowerPoint Addin includes 23 time-saving features to use with just 1 click, such as: swapping the positions of shapes, breaking a table into shapes, pasting an object onto all your slides, easily moving an object closer/further from another one, etc.
Swap Shapes
One key function of the MLC PowerPoint Addin is Swap Shapes.
Think for a moment – how would you swap 2 shapes in PowerPoint?
Let’s suppose you have 2 shapes (or pictures) and you want A to take the place of B or vice versa. You take A, you start moving it over B, you send A behind B, then you take B and you’ll probably realize you have lost the position of A. Now you undo (CTRL+Z) , you start again but this time you duplicate A in order to keep the initial position before you move it. Even though you can finally manage to swap the two positions it takes far too many steps for such a simple operation. PowerPoint doesn’t offer a straightforward solution.
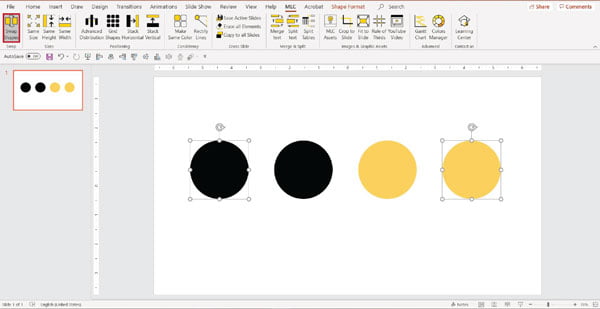
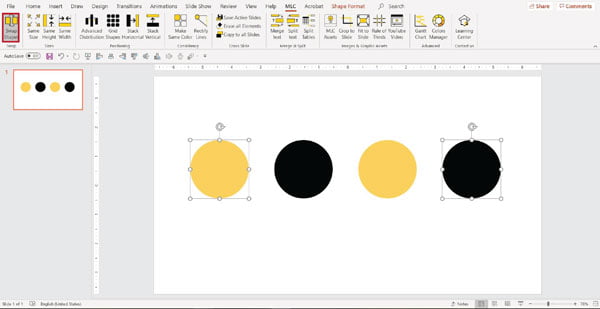
However, with just one click, Swap Shapes allows you to swap the position of one object with another. In the following image, I have highlighted two icons that I want to swap.
Swap Shapes reverses the position of two objects, allowing you to preserve alignments and distributions. All you need to do is select the two shapes, then click the Swap Shapes button. Boom, result. Maximum efficiency in just a few seconds!
Make Same Size
The second key function of the MLC PowerPoint Addin, is Make Same Size. It can be very useful when you have many elements or photos and you want to make them all uniform.
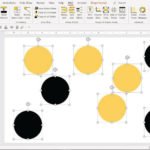
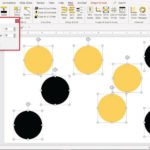
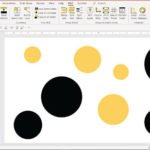
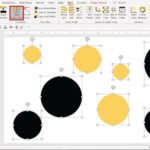
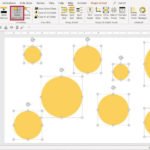
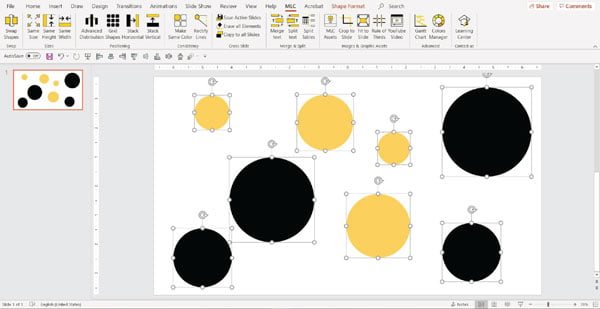
With the usual CTRL+ click, you select the shapes, starting with the one whose size you want to copy:
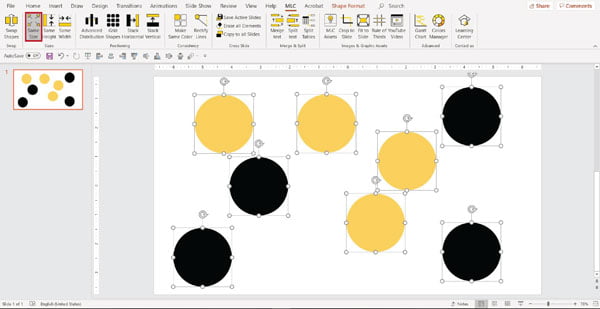
Click on the Make same size button. Magic! All the shapes have been resized, to match the size of the first one you selected.
Grid Shapes
However, at this point, I noticed that it would be necessary and natural to make another change: to rearrange the shapes in order and make them equidistant from one another.
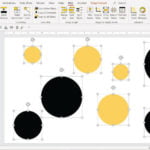
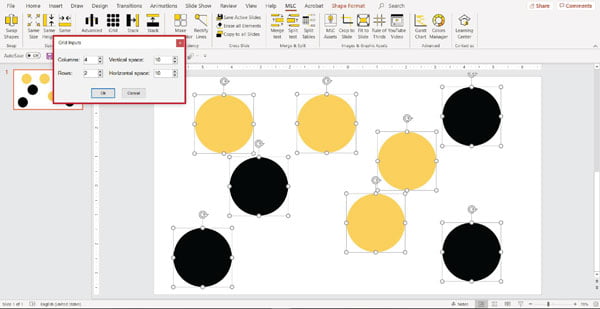
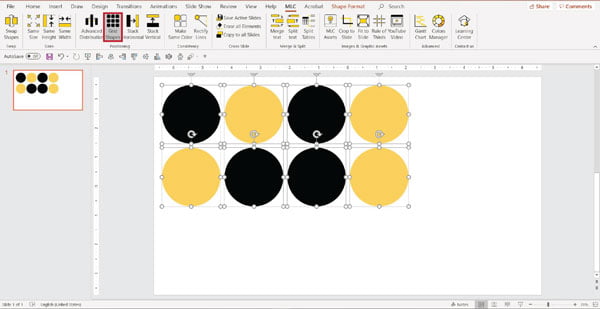
As you can see, we have 8 elements that could be arranged in 2 rows and 4 columns, so, let’s select them all and click on Grid Shapes.
From here, we can decide the distance between one object and another. I chose 10 mm horizontally and 10 mm vertically:
Now click OK. Look how wonderful it is!
These functions can be applied to images as well. This function could be very useful, for example when making an image grid with your clients’ logos.
Make Same Color
Make Same Size recognizes whether you are trying to resize images or shapes and always delivers the result. There is a second button that works with the same logic but only on the colors. Make Same Color is an extremely simple-to-use function and, at the same time, it is one of the smartest buttons of the MLC PowerPoint Addin. It allows you to change the color of many objects at the same time.
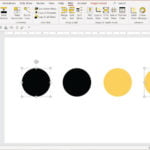
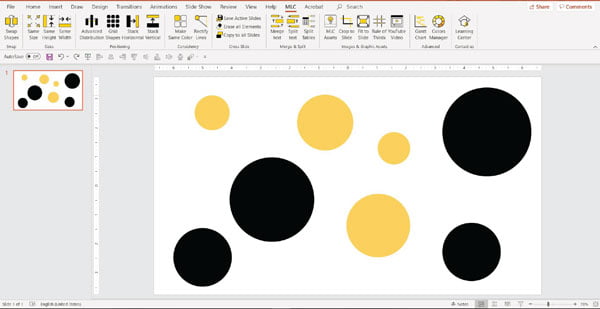
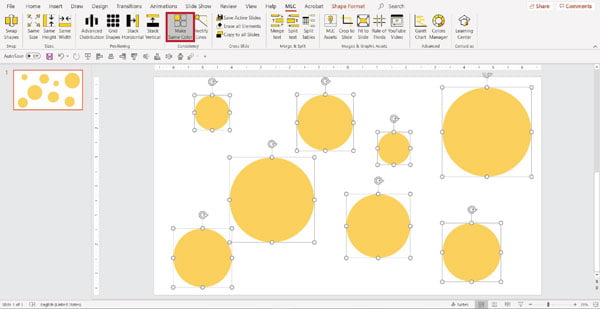
For example, here is a slide with eight shapes in different colors and we want to make them consistent:
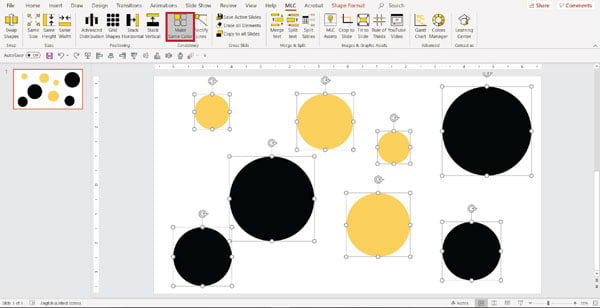
If you want to standardize the color of your shapes, the first thing to do is CTRL+click the target color shape first followed by all the others. In this case, I clicked on the orange shape first:
Now, with just one click on Make Same Color:
Same Height
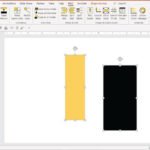
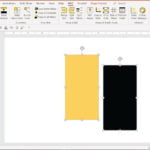
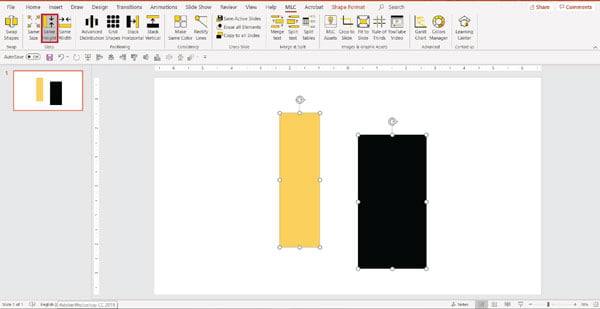
One of the most-used functions is Same Height. To work you select both shapes but first select the shape that is the height you want and click on the button Same Height:
Same Width
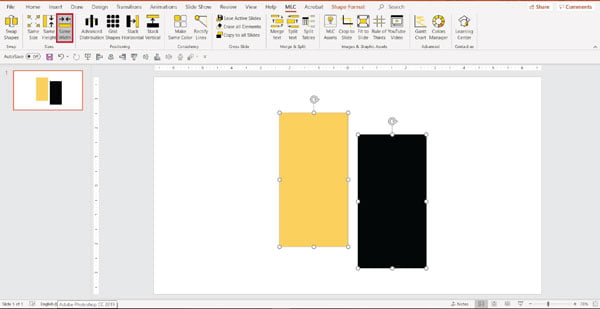
If you also need to set the width, just CTRL + click on the dark blue shape for example, then on the other one. Now we have two identical shapes!
The functions above are the most-used ones of the MLC PowerPoint Addin, but let’s look at some of the most recently added functions.
The Rule of Thirds
The Rule of Thirds automatically sets the guides in your PowerPoint on a specific, magic position. The Rule of Thirds is, in my opinion, the one golden rule that can revolutionize the appearance and impact of your slides. To find out more check out this guide on how to create an effective presentation in PowerPoint using the Rule of Thirds.
MLC Assets
The best slides are not only made up of elements that you can find on PowerPoint – often you need to go to the web to look for images, icons, vectors and other elements. Every time you leave PowerPoint to scout for a specific object you are wasting time and energy; and you might end up with a low-quality object that will make your presentation look poor anyway.
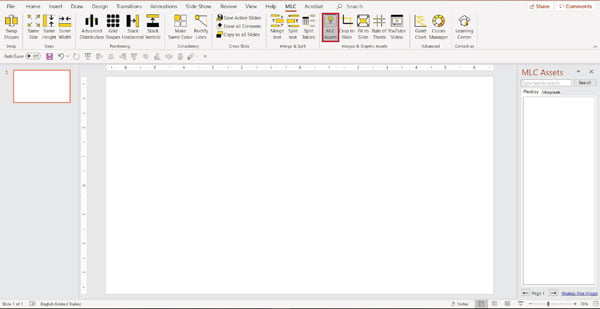
This is why the MLC Assets function is useful: a multimedia library where you just need to click on an element, and you’ll get the best quality of it ready to be used on your slides. MLC Assets nowadays works with free, high resolution images. You can get millions of beautiful images for your slides with just one click. Here’s how.
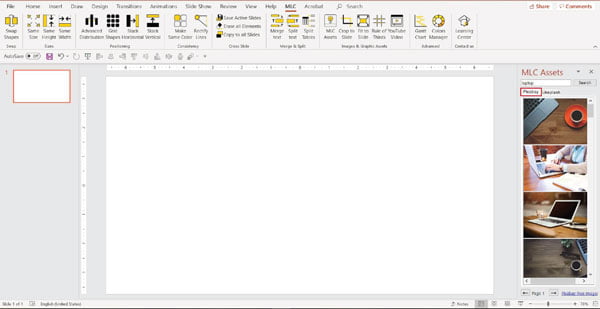
First, click on MLC Assets:
Type in the box what you are looking for and MLC Assets will find you loads of free images you can choose from. For example, I searched Laptop:
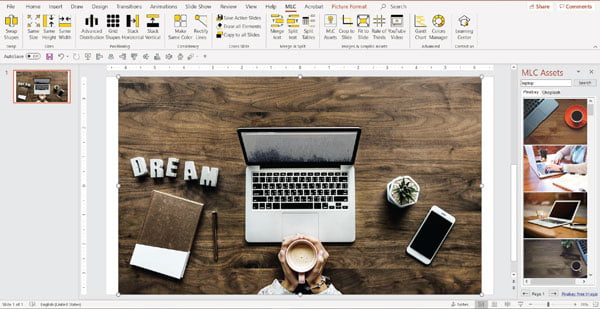
Now I just need to click on the image I want and it will appear on the slide:
Thanks to MLC PowerPoint Addin you’ll be able to access millions of high quality images free from copyrights ready to be used on your slides.
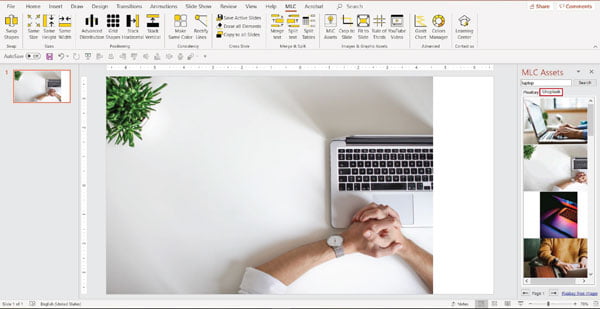
You can get images from Pixabay.com and from Unsplash.com, just select the tab you like the most and proceed or search in both and compare the images to find the best fit for your slide.
It is very useful and smart, isn’t it?
Gantt Chart
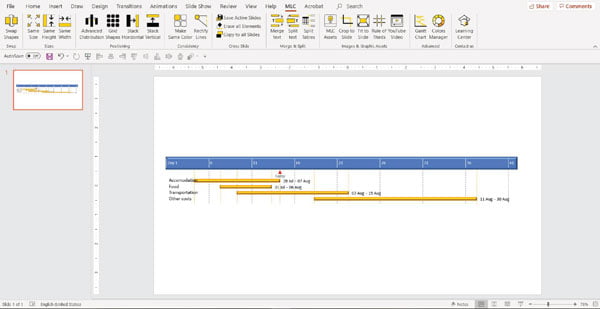
A Gantt Chart is used across all industries and organizations in project management. However, it can be quite difficult and time-consuming to create and update a Gantt chart in PowerPoint.
This feature is one of the latest included in the MLC PowerPoint Addin. The aim is to create and update Gantt charts very quickly, without the need to import them from other programs. Moreover, this function is extra useful because once you have created a Gantt chart, every part of it becomes an object of PowerPoint so, anyone can edit it, including those people who do not have the MLC PowerPoint Addin.
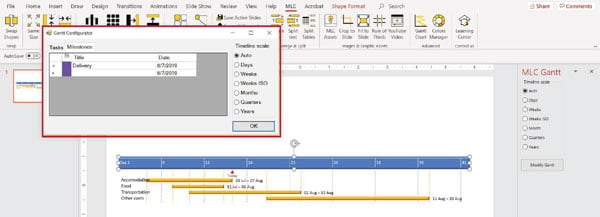
When you click on the Gantt Chart button, you can see a lot of options to design your customized chart:
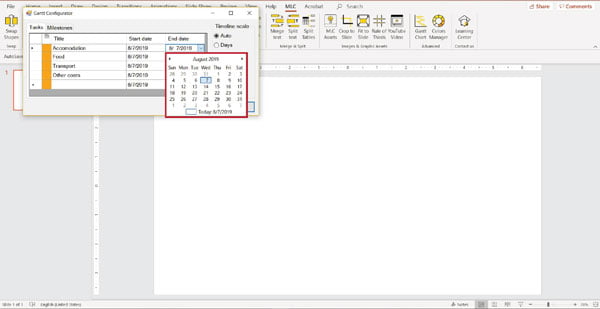
Clicking on the Task tab, you can insert your activities simply by writing the name and the duration of them. You can select the date with a click on the calendar or enter it by writing in the window, respecting the format:
At this point, click OK and the chart will be created:
Furthermore, if you have different categories of activities, you can group them in different colors or change the color of the time band.
At this point, you can also set the milestones that are used to show a specific moment in time, for example, when a delivery is expected:
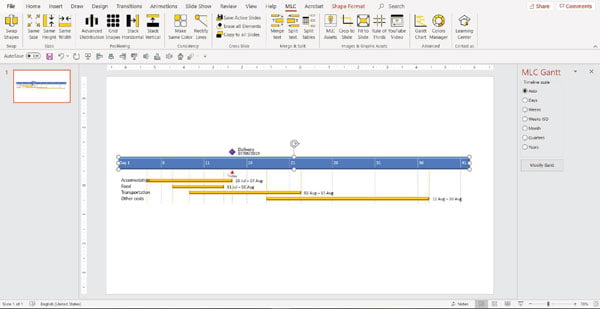
Add as many milestones as you wish and then click on the OK button. You’ll notice that the milestones will be indicated by a rhombus on top of the time band and a dotted line will show where they intersect the tasks you’ve previously entered:
And the price?
The MLC PowerPoint Addin license includes 23 functions plus all the updates that are constantly released. The cost of the subscription is $US 57.77 a year, including support and the subscription to the official Lean Presentation Design community where you can contribute suggestions for new functions to be developed.
Consider how much time this addin will save you, then compare the value of the time saved against $US 57.77. How much is your time worth?
Flevy Tools
One of the things that wastes a lot of time at work is definitely creating charts. How do you solve the problem and save time? Flevy Tools is a PowerPoint add-in for creating business charts, commonly used by management consultants. Twelve types of diagrams are supported:
- Approach Diagrams
- Step Box Diagrams
- Harvey Ball Diagrams
- Gantt Diagrams
- Circular Diagrams
- Pyramid Diagrams
- Rating Charts
- Relationship Diagrams
- Segment Diagrams
- Waterfall Charts
- Matrix Charts
- Value Chain Diagrams
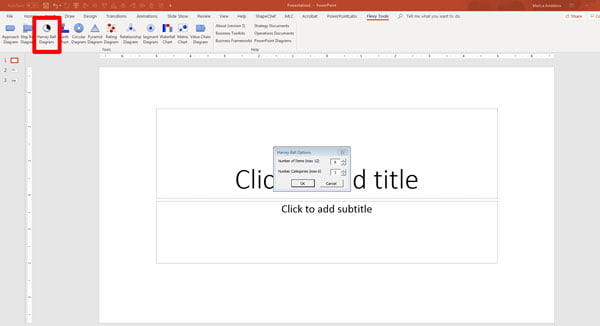
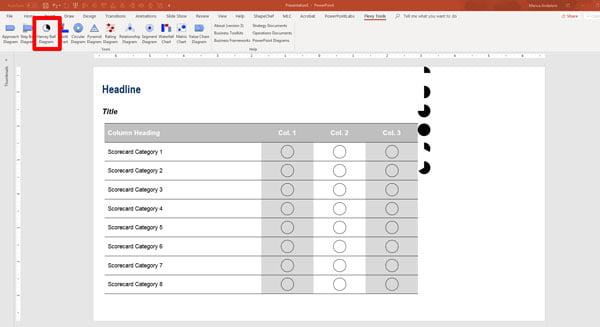
Let me show you how easy it is to create a Harvey Ball Diagram, for example. When generating a diagram, there is a popup where you can specify the attributes of the diagram (e.g. number of chevrons, number of categories, etc.).
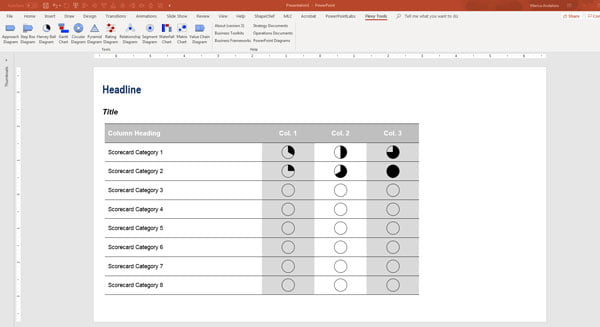
Once generated, you can further customize the diagram, as the diagram is built using AutoShapes:
With this process, you can create all the graphs you want and make them usable for your business presentations.
Also worth noting, Flevy hosts a wealth of business frameworks. Business frameworks are in-depth business training guides—the same used by top global consulting firms when they deploy their consulting project teams to Fortune 500 companies.
The price?
They used to sell it for $199 but now they are giving this tool away for free for a limited time.
think-cell
think-cell is the add-in for Microsoft Office if you need to create data-heavy presentations. It seamlessly integrates into PowerPoint and Excel to help you create complex charts and layouts, including Waterfall, Gantt and Marimekko charts, as well as process flows. More than 40 chart types are supported.
Developed in close cooperation with top consulting firms, the software saves you, on average, 70% of your time when working on charts and helps you to create high-quality output consistent with your corporate brand. It is very easy to use, and you will find yourself becoming a pro in just a few hours.
think-cell’s automated linking of charts and Excel data fosters consistency and correctness, and helps you save hours when updating your charts’ numbers. This is useful for FP&A teams that have to create and update recurring financial reports on a regular basis.
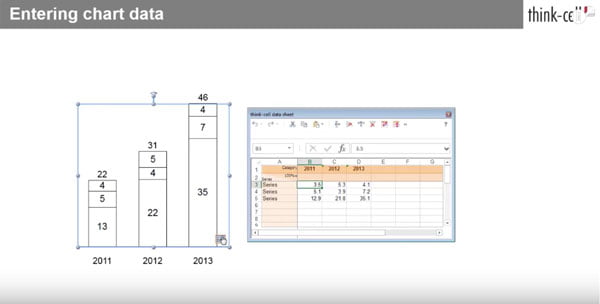
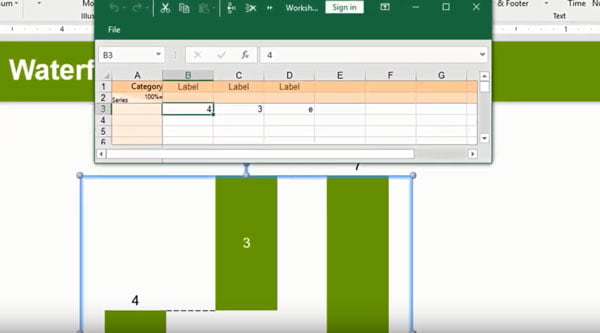
You will find the graphs in the Elements section: Pie charts, Waterfall charts and similar graphs have an associated data sheet (except for the Gantt chart) that appears by double-clicking the chart or by clicking the Open Datasheet button:
Inside the Excel box, you can work normally, modifying cells, adding rows and columns. You can also use formulas and shortcuts as though you’re working on a Excel worksheet. You can do all of this straight in PowerPoint, with no need to even think about Excel!
Waterfall Charts
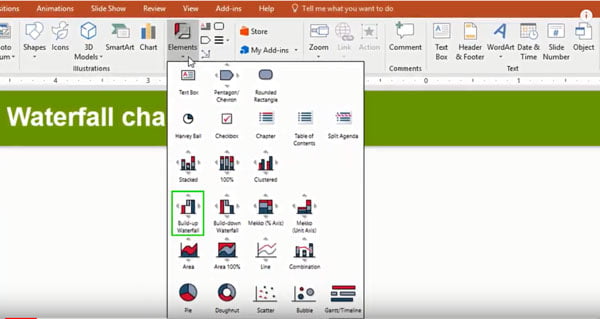
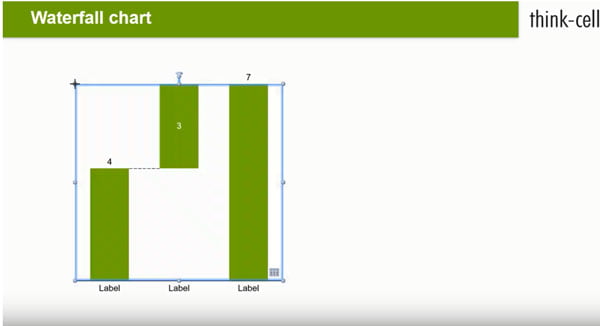
An interesting functionality of thinkcell is the Waterfall chart, which is used to show positive and negative changes to a value over a period of time. To create a Waterfall Chart, the first step is to go to the PowerPoint ribbon and click on Elements > Build-up Waterfall icon. This places the chart onto your slide:
Now, a build-up waterfall is inserted.
Open the datasheet to add your values:
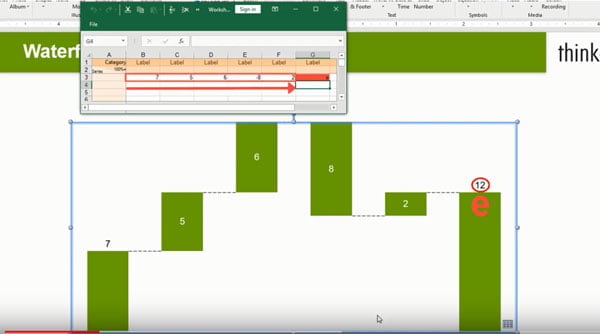
When your data is inserted, you will set an automatic sum of your chart by clicking on a cell and typing e:
How simple is that?
Another great advantage is that presentations created using think-cell are 100% compatible with PowerPoint. The think-cell elements appear as regular PowerPoint shapes, such as textboxes and chart objects. This means that coworkers and clients who do not have think-cell installed can still open and easily edit the files you share with them.
And the price?
think-cell has a target group of medium-large companies, so the minimum number of licenses to purchase is equivalent to 5. At 45€ in total, this corresponds to 189€ per user. The cost includes all updates and technical assistance. They also have advantageous packages as the number of users increases.
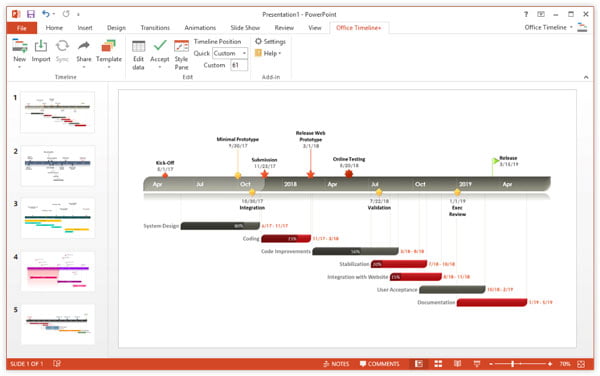
Office Timeline
Do you need to create and manage an advanced Gantt chart in PowerPoint while skipping Excel? Then Office Timeline is the add-in you need.
Office Timeline was specifically developed to provide all the tools you need to design project charts like Gantt diagrams and timelines. Another feature is to load your Excel sheets on PowerPoint and continue to edit them directly from there.
Office Timeline leads you through a user-friendly graphic interface to input the data you need to be displayed, for example, milestones and tasks, and it takes care of visualizing them and recreating a timeline with the use of PowerPoint standard objects. Therefore, you can always edit the objects the same way you would edit a set of common shapes in PowerPoint.
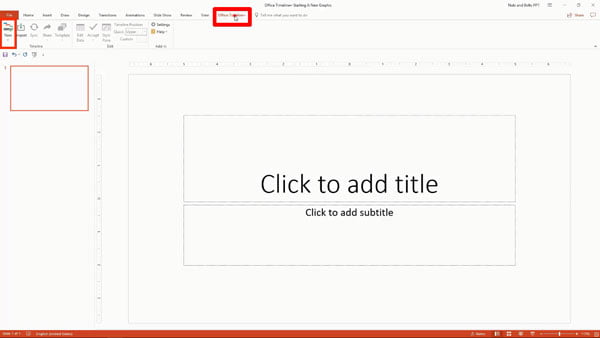
Let’s look at the steps to create a timeline together. The first step is to go to Timeline section and click on New:
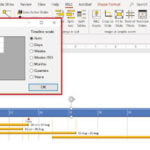
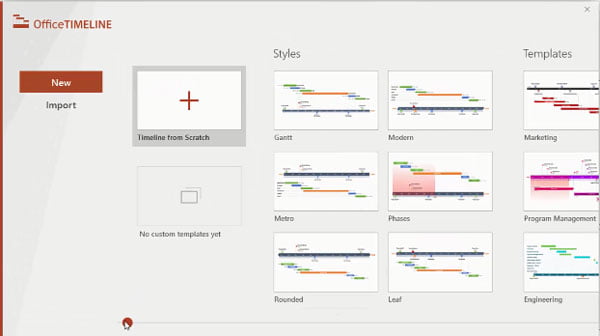
Choose the timeline style you prefer, according to your needs:
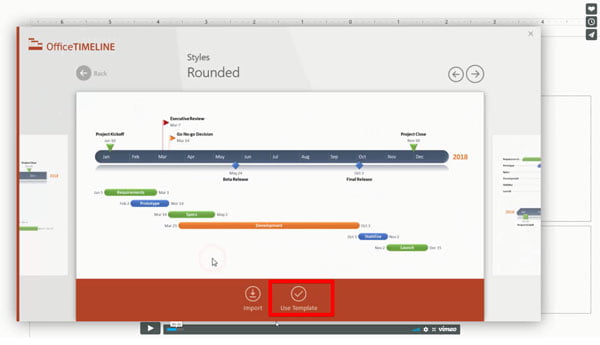
In this example, I chose Rounded style:
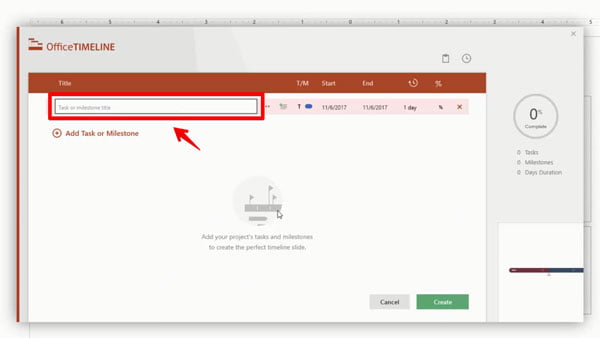
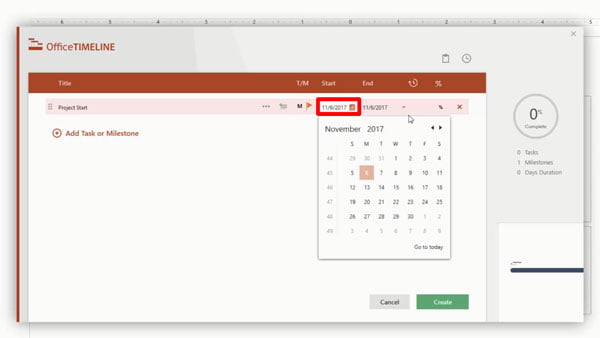
The most important part of creating a Gantt chart is when you start setting up your tasks or milestones:
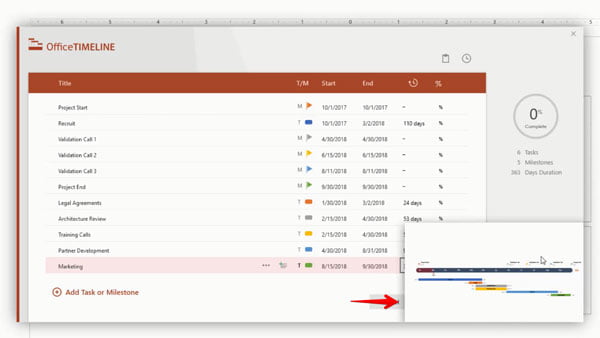
You can insert the date and the duration of your tasks, as well as customize the color.
When everything is ready, just click on Create:
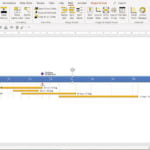
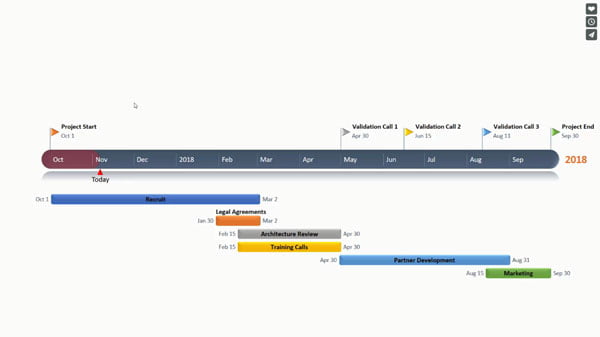
After few seconds, the timeline will appear:
How much does it cost?
There are two options: the free one and the paid one, which has many more features that increase the productivity of your business presentations. It costs $59 a year and includes all updates and technical assistance.
The Noun Project
The Noun Project is an add-in that aggregates icons and symbols. It is an online symbol library in vector format (SVG) issued with licenses that allow their reuse. An important strength of this project is that new icons are inserted by experts in the field, such as designers, every day.
The Noun Project also includes icons with a social theme, such as global warming and human rights.
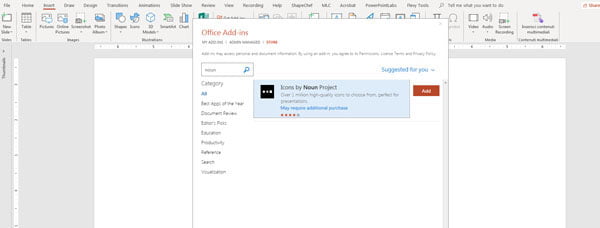
To download the add-in, you just need to go to PowerPoint, click on Insert section and click on Get Add-ins Button:
Now search the list of add-ins. When you find it, click the Add button.
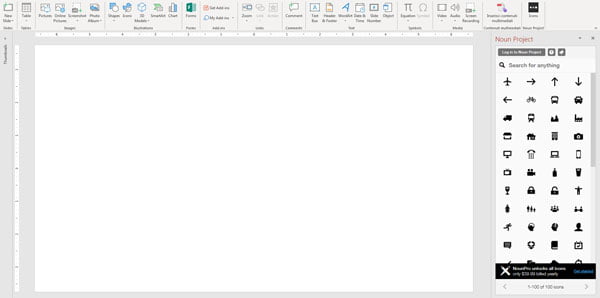
Noun Project will now show on your PowerPoint ribbon:
There are more or less 100 free icons to use in SVG format:
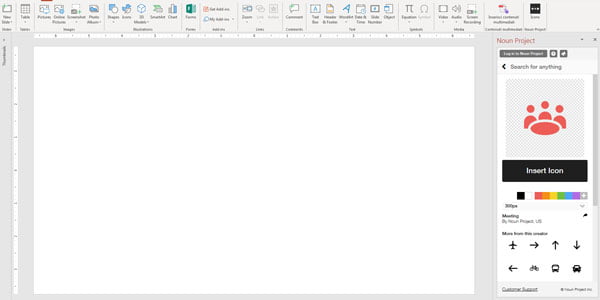
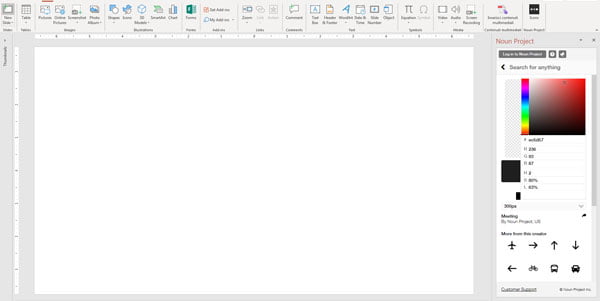
Before you insert the image on the slide, Noun Project lets you choose the color of the icon and the gradient from its panel but, being SVG files you can always edit them afterwards:
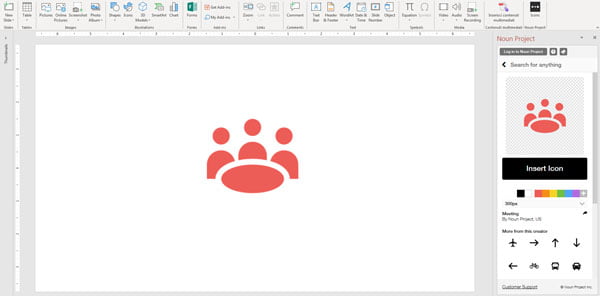
Once it is inserted, you can use the icon to create professional presentations:
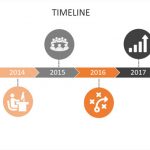
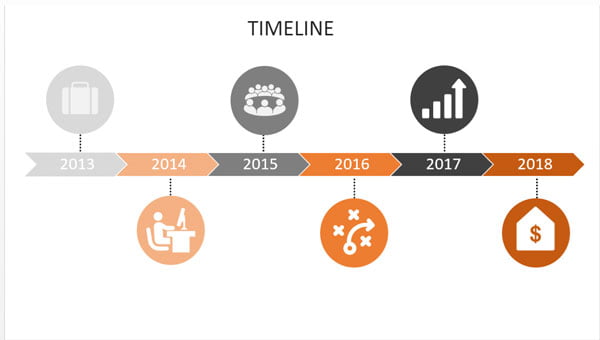
I created this timeline to show how easily you can use this add-in to craft wonderful slides, which will grab your audience’s attention:
There aren’t many steps to do this and the result will be very professional and effective.
What does it cost?
As I said before, Noun Project gives you 100 free icons, but to unlock the others – over 1 million, according to their website! – you need to pay just $39.99 per year.
Pexels
You’re preparing one of your slideshows and you have very little time to condense all the information. The last thing you want to do is waste more time looking for the images you need.
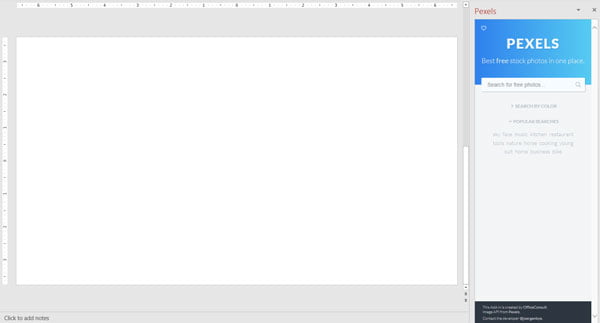
Pexels is a very innovative and useful add-in. (But don’t just take my word for it – other contributors to Presentation Guru also recommend Pexels.) You can download it for free, in the same way as we downloaded Noun Project above, and then search for images directly from PowerPoint without having to search for them from the browser.
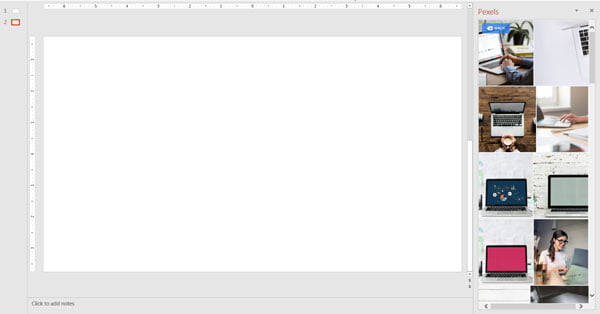
Write in the box what are you searching for, e.g. Laptop in my case. Click on your chosen image and it will be added to the slide automatically:
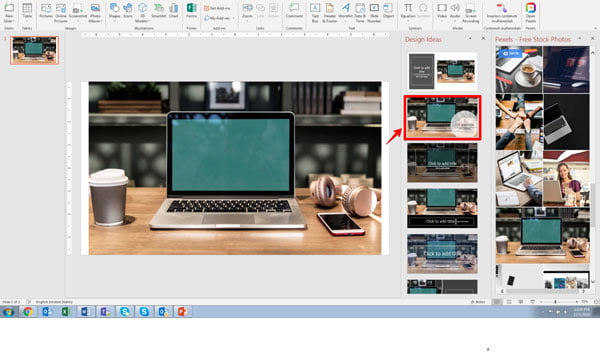
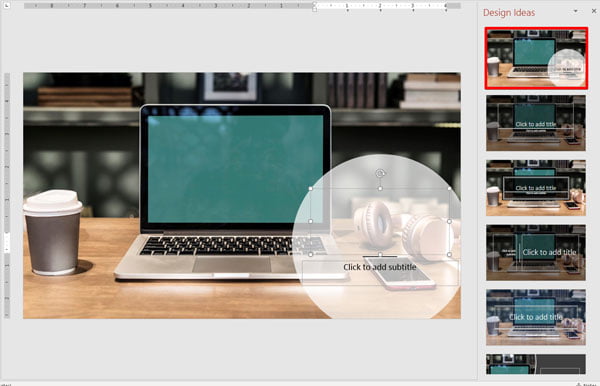
If you want, Pexels shows you different layouts to enrich your pictures. Flick among the different ones and examine the result:
At this point, I would like to remind readers that sometimes, despite the message in your content being clear, that message can get lost when translated into your PowerPoint. To make really good presentations it is worthwhile studying some design basics to ensure that your message can be fully appreciated.
PowerPoint Labs
PowerPoint Labs is an add-in that will make it easier for you to deal with your business slides and make them more impactful.
Fit to Slide
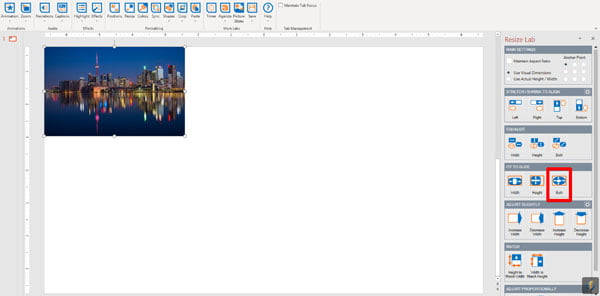
The first feature I have selected for you, called Fit to Slide, is very interesting as it can resize an image with just one click. If you are uploading images and do not want to waste time on resizing the image to the slide, this is the perfect solution. You just need to upload the picture and go to the Resize section:
Click the highlighted button:
What do you think of this function? It is useful, isn’t it?
Crop to Slide
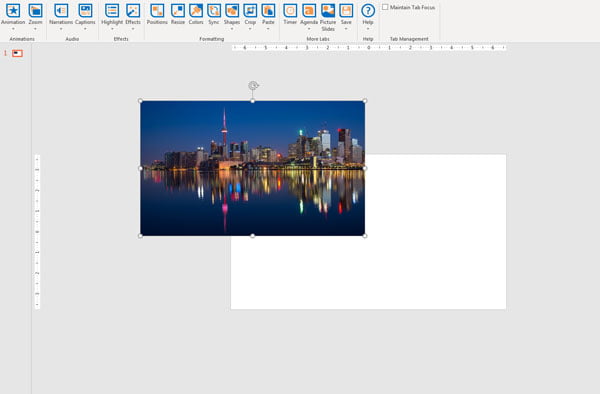
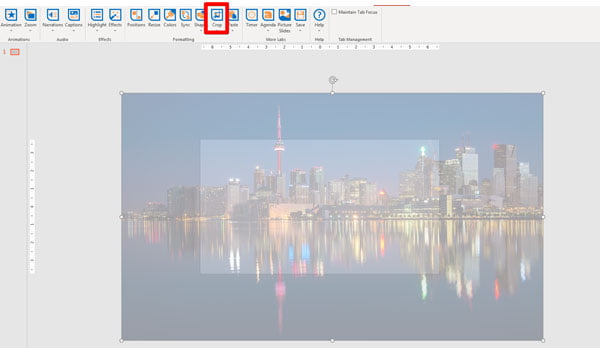
Have you ever wanted to insert only part of the image onto a slide and thought that to do that you needed to use other programs outside PowerPoint? With PowerPoint Labs it’s much simpler than you think. Let me show you. I have chosen this image but only want to set a part of the photo on the slide. The solution is to cut it out:
Firstly, overlay the chosen picture section exactly on the slide:
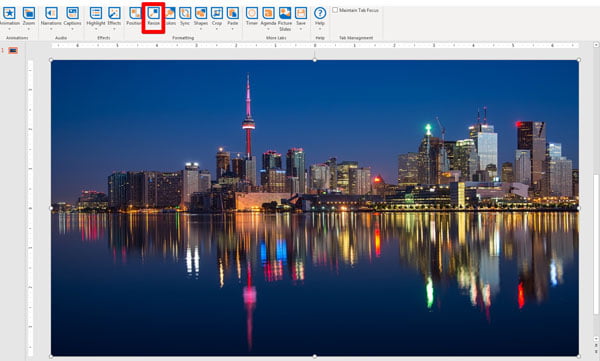
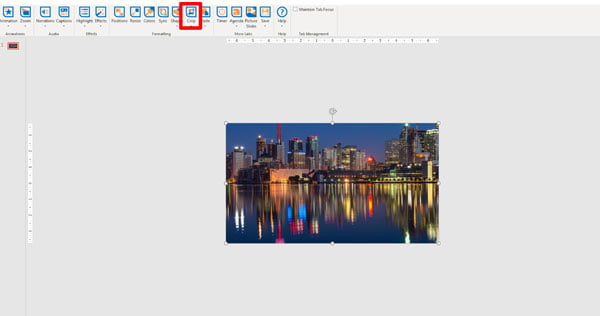
Click on Crop > Crop to Slide and the picture will be resized:
Colors
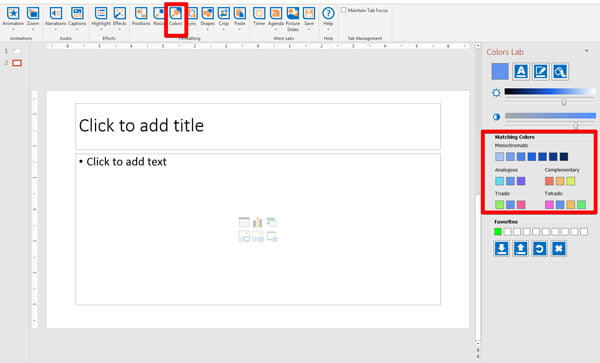
I think this will be interesting for those who care about making presentations with a more ‘professionally designed’ style. This function allows the user, once the reference color has been chosen, to outline the complementary color and the gradient:
In my opinion, the immediate choice of the gradient helps you a lot because in a few seconds, you can create an effective template to apply to the slides and boost your productivity.
How much will this Addin cost?
This is the best bit – it is free!
Power Mockup
Do you need to quickly design the mockup of a website to show the client what it will look like? Or maybe you need to design it to brief your developers?
Designing an entire mockup might require a lot of time, as every window has buttons, bars, labels and many other elements you would need to recreate and organize.
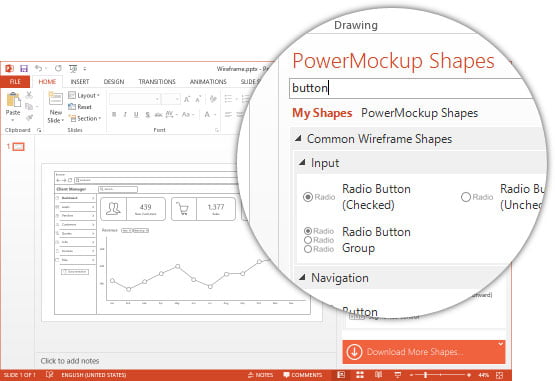
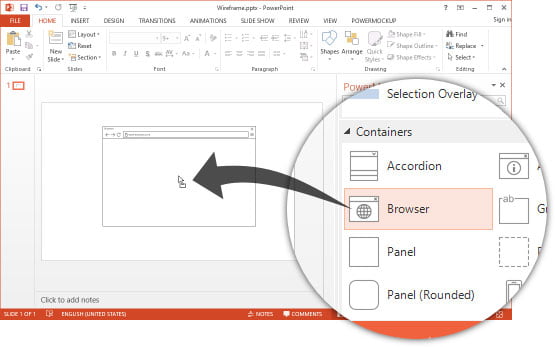
PowerMockup is a PowerPoint add-in that helps you do just that! It is a prototyping toolkit for PowerPoint. It helps to create wireframes and mockups for websites as well as mobile and desktop applications. To build a prototype, simply select shapes and icons from the PowerMockup library and drag them into a PowerPoint slide. You can then use PowerPoint’s slideshow and animation features to make your prototype interactive.
PowerMockup enables a right sidebar, where you’ll find plenty of super useful web elements that you can search easily.
You just need to drag and drop in your slides.
The PowerMockup library is already quite extensive, but the PowerMockup team is continuously expanding it. You can help it to grow by adding your own shapes and building a custom library of commonly used shapes, which you can share with other users.
How much does it cost?
It depends on which license you need. There is a trial version available that you can use, but it limits the number of shapes you can use.
ShapeChef
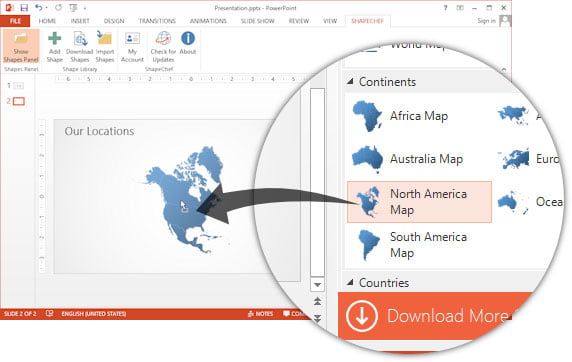
If you think PowerMockup is too specific, you might take a look at ShapeChef instead. ShapeChef is a graphic and chart library for PowerPoint that helps you organize your graphics, charts and other assets for easy reuse. The tool integrates a library pane into the PowerPoint window, from which items can be dragged and dropped into a slide:
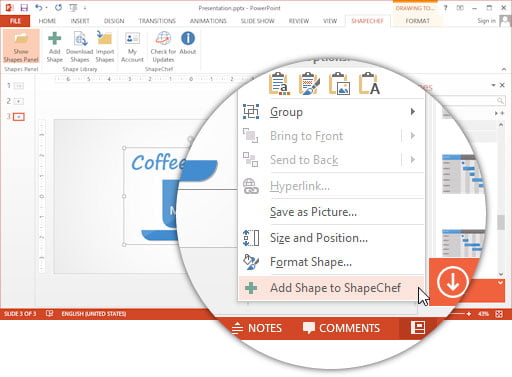
Adding new items to the library is very simple: select a graphic on a slide and choose Add to ShapeChef from the context menu:
If you are searching for professional PowerPoint graphics and charts for a presentation, ShapeChef can help you with that as well. You can download dozens of ready-to-use graphic collections directly from the ShapeChef server via the tool and add them to your library. Please note however that currently ShapeChef only works with PowerPoint for Windows.
And the price?
Just as with PowerMockup there are a range of licenses on offer but overall it is less expensive than PowerMockup but also ensures you excellent results.
You can also read Farshad Iqbal’s earlier review of ShapeChef here.
Conclusion
I’ve outlined a selection of add-ins that I think can help you to make your presentations more effective. Each of them has its own peculiarities and its top functions.
There are functions that allow you to create graphs and edit them directly from PowerPoint, avoiding exporting them from Excel. There are some that help with design functions, such as making shapes the same color and size; cutting images and adapt them to the slide with a single click; choosing infinite icons from plugins and then customizing them. If you need to create wireframes and mockups for websites and for mobile applications, you now know how and which add-in to use.
I think these add-ins will make a huge difference to your presentations – and your workload. Do you know any other add-ins worth sharing? Let us know in the comments below sharing an accurate description to enrich the article even more.



















Robert
14th February 2019 at 11:25 am
This comparison does not include all the add-ins on the market.
There are a few more, which needs to be added:
1. Efficient Elements, https://www.efficient-elements.com
2. Veodin, https://www.veodin.com
3. “Made in Office”, https://www.made-in-office.com/en/empower-slides/
Also it is important to mention that Think Cell and “Made in Office” offer a Mac Version. Veodin is currently working on a Mac version.
Could you please update the article.
Thanks,
Robert
Rosie Hoyland
14th February 2019 at 3:49 pm
Thanks Robert for this update. The article never claimed to include all the add-ins on the market – that would be a very long post indeed! – but the 3 that you highlight are great additions to the list and we would encourage our readers to check them out.
Robert
14th February 2019 at 7:59 pm
Thanks Rosie. May I can suggest an article? The MAC market is growing every year. Companies like SAP, Salesforce, Allianz and even Accenture as one of the biggest consulting companies are using more and more MACs. MAC users will also using PowerPoint for MAC. Unfortunately MAC users are looking for the same tools and add-ins that Windows users are using with PowerPoint. Companies like Think-Cell, Videos and Made-in-Office know the need and are working on MAC versions or already have it in their portfolio. But it is hard to find an overview. Would it be possible to find have an article on this amazing page? Thanks Robert
Rosie Hoyland
15th February 2019 at 9:03 am
That’s a really good idea, Robert – are you the man to write it?
Max
15th August 2019 at 7:53 am
Are you looking for writers?
Rosie Hoyland
20th August 2019 at 9:18 am
Always interested in writers who can share ideas that will help our readers better themselves as speakers, presenters or presentation designers. If you’re interested in writing, please contact me directly via our Contact Form
Neil
11th April 2019 at 2:45 pm
Hi Robert,
You are correct. In this regard I want to add one more addin in this list.
‘DrawingBoard’ it has lots of functionalities with editable icons, shapes, infographics, wire-frames etc.
DrawingBoard
Free download:
https://www.next2office.com/
Youtube Videos:
https://www.youtube.com/channel/UCfvKI1ao17fIW7DiR3EPAcw/videos
OLIVIA MODESTI
20th May 2019 at 4:06 pm
Yes I agree with you Robert and here the new one I found which is one of the best I think: https://addineo.com
Cheers,
Olivia
iSlide PowerPoint
24th January 2021 at 9:11 am
Robert,
You are so right! Not complete at all, You bring in some good alternatives.
but luckily I saw a post of the iSlide add-in as well here below.
That is my personal favourite, maybe you should check that one out sometimes!
https://islide-powerpoint.com/en/
Nick
3rd October 2021 at 5:55 pm
Agree, this add-in is actually a mandatory installation after installing Office or WPS.
This saves you so much time.. For the record, I’m using the Premium version, as I did not want to look at the free resources only..
Ben
7th July 2019 at 5:54 pm
You are missing the best PowerPoint add-in named iSlide! Try it for free 7 days, just sent a mail to [email protected]. Look at it here: https://secure.2checkout.com/affiliate.php?ACCOUNT=CHENGDUI&AFFILIATE=117061&PATH=https%3A%2F%2Fen.islide.cc%2Ftemplateldg-bo%3FAFFILIATE%3D117061 After testing get 20% OFF using the code: DISCOUNT.
Ben
20th January 2020 at 6:33 pm
Check out https://www.participoll.com/ which is an add-in turns PowerPoint into an audience interaction tool via polls inside your slides
Rosie Hoyland
21st January 2020 at 10:31 am
Good tip. We have! Check out https://www.presentation-guru.com/how-to-get-instant-feedback-from-your-audience/ for Farshad Iqbal’s review of it.
Office SuperChargers
6th February 2020 at 5:48 pm
you should also consider IDMB PowerPoint Supercharger which installs to your desktop. It delivers dozens of cool tools to speed up your work.
https://www.officesupercharger.co.uk/software/powerpoint-supercharger
It can automatically clean and tidy your presentation, sort out capitalisation, add TOCs, standardise formating of tables, pictures, kickers and much more.
You can also get a free 30 day trial
Ben Oostdam
5th April 2020 at 11:55 am
I still think that the iSlide Powerpoint add-in is better, faster and more time saving.
Please add this to your list! Even 95% of the features is free to use!
Get it for free on: https://islide-powerpoint.com and just try it out!
It really belongs in this list.
Rosie Hoyland
9th April 2020 at 11:48 am
Well you’ve sold it well! I guess we’ll need to take a look now!
Silvia
18th April 2020 at 9:43 am
Hello, Maurizio and Rosie! Please do look at that iSlide add-in, it’s available for MAC and WPS users as well, in 8 different languages even.
You have have a lot of readers, I think they can benefit from it!
the iSlide Support Team
Rosie Hoyland
21st April 2020 at 4:06 pm
Sounds interesting – I’ll take a look
PHYLLIS m CAPP
22nd August 2020 at 4:36 pm
PowerPointLabs is only available through the 2016 version. I have a 2019 program Can I still use it??
Rosie Hoyland
17th September 2020 at 12:38 pm
Hi Phyllis
We asked PowerPointLabs directly and they have confirmed that YES – you can use their add-in with Office 2019. There’ll be no stopping you now! Good luck.
Silvia van de Berg
26th August 2020 at 8:00 pm
Hi, nice article, our compliments!
We would like you to take a minute to look at our free iSlide PowerPoint add-in.
https://islide-powerpoint.com/en/support/tips-ideas/15-minutes-en
This is an add-in that everybody should use, because of it’s libraries, scrollbars and other features that should always been in PowerPoint. It only needs registration of an email account to get started. In 9 major languages and for Windows and MacOS!
Please take a look at our website and contact me if you have any questions that I can help you with.
Regards,
Silvia van de Berg